E-Boston
Sometimes the City of Boston surprises me with their effective use of technology. It’s generally pretty hard to find an example of the government doing a good job implementing a large technology/citizen service project, but I recently discovered the Boston Water and Sewer Commission has put all usage information online.
So you can actually see your monthly water usage, with the numbers for each month appearing with Javascript mouseover:
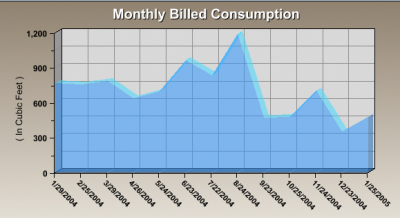
Incidentally, that spike in late July—that’s not us. We moved in a couple days after that. I understand the prior owner of the house reads my blog (hi Peter!) so he is to blame for taking too many showers that month.
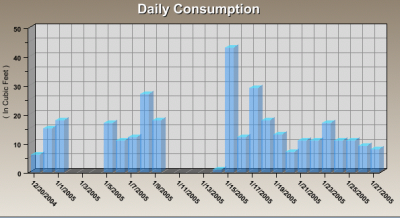
In fact, you can even see daily usage, right up to yesterday (I suppose they can’t do today yet because you’re not done using your water):
The only problem with the site is that it has a stupid Flash/Shockwave entry screen. There’s absolutely no reason to do this—plain old HTML would have worked fine, and been more accessible to blind Internet users. That said, it’s at least well done Flash and doesn’t have unnecessary animation or blinkies.
The City of Boston Assessing Department has a similarly valuable tool, which also has the additional benefit of allowing you to spy on your neighbors. (Hey, my friends’ nearby house doubled in assessed value from 2003 to 2004—probably the result of a gut rehab). Being able to see the assessed value of any property, the history of assessments, and some of the basic information about the property without getting up from one’s desk makes it a lot easier to figure out if one is being treated fairly by the tax man.
The Suffolk County Registry of Deeds has a much clunkier interface, but has managed to get several year’s worth of filings indexed online, and is making progress at scanning the contents of those filings—another valuable way to snoop on your neighbors (“Oh, I see, they took out a second mortgage to build that addition!”) — on second thought, maybe this whole blog entry belongs in the ‘privacy’ category.
One of the most impressive projects is “The Boston Atlas” (aka mapjunction; Java client required). The Boston Atlas is an interactive map of Boston that includes various historical (back to the 1700’s!) and current aerial images, with the option to superpose several different data sets, including streets, open space, census data, wards, precincts, building footprints, etc., and select the color for plotting the various data sets. It’s really pretty cool.
Here’s my house, with a little blue arrow added to point to the house, yellow lines to indicate streets and red lines around open space. Click to get a more legible version:

(please don’t use this information to plot a terrorist attack against my house or the parking lot at the end of the street).
adamg Jan 28
If you like the Boston Atlas, you’ll love the state’s OLIVER – same idea, but you can expand your views statewide and with a lot more datasets to overlay on the maps.
http://maps.massgis.state.ma.us/massgis_viewer/index.htm
Ari Pollak Jan 28
Wow, the boston atlas is pretty cool.